
Form analytics
WordPress Form Analytics: Views, Starts, Drop-Off, and Completion Rate
Measure WordPress form views, starts, completion rate, validation errors, field drop-off, and attribution without confusing traffic with form quality.

WordPress form analytics should tell you where the form loses people: before they start, while they answer, during validation, or after they press submit. A single page conversion rate collapses those different problems into one number.
The useful baseline is a funnel with explicit definitions. Count a view when the form appears, a start when someone interacts with a field, and a completion only after the server accepts the submission.
WordPress form analytics needs a defined funnel
Views, starts, and completions answer different questions. Keep them separate before adding field-level detail.
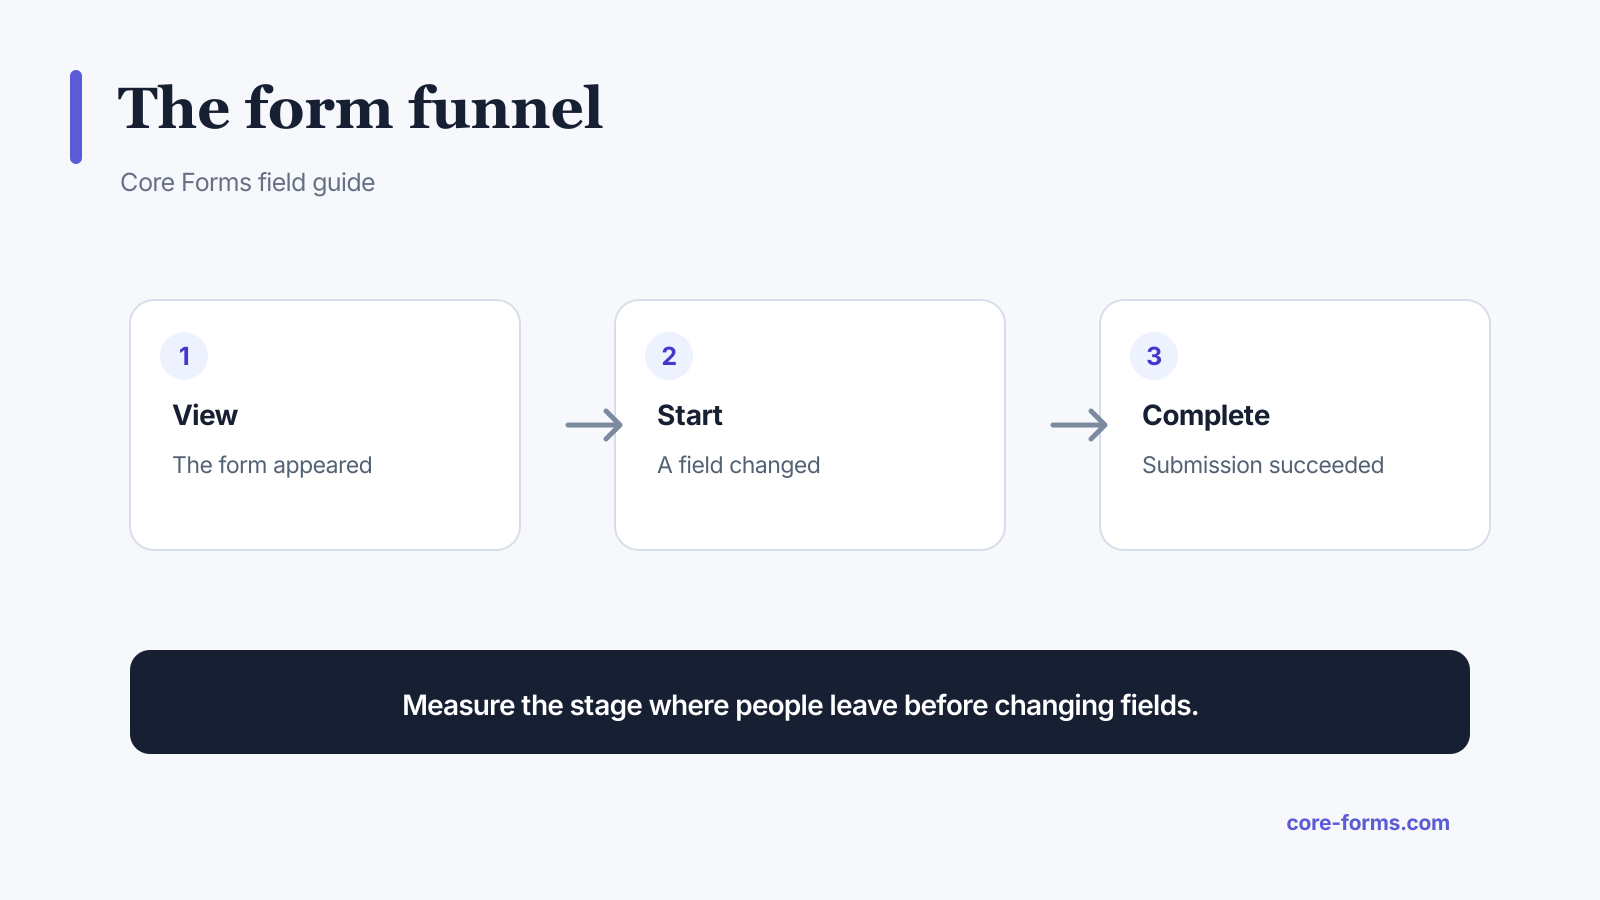 Measure the stage where people leave before changing copy or fields.
Use these definitions:
- View: the form entered the page or viewport under your chosen rule.
- Start: the visitor changed, selected, or meaningfully focused a field.
- Validation error: a submit attempt or field transition failed a defined rule.
- Completion: the server accepted the submission.
- Drop-off: a started session ended without completion.
Document whether views count page loads or actual form visibility. A form near the footer may receive many page loads but far fewer real impressions.
Calculate start and completion rates
start rate = starts ÷ views × 100
completion rate = completions ÷ starts × 100
view-to-completion rate = completions ÷ views × 100
Each rate suggests a different investigation.
Low start rate can point to:
- weak or unclear offer;
- low trust;
- poor placement;
- intimidating first screen;
- missing context;
- wrong audience or traffic source.
Low completion rate can point to:
- unnecessary or confusing fields;
- validation failures;
- unexpected sensitivity;
- poor mobile behavior;
- conditional-path problems;
- network or action failures.
Field drop-off is a clue, not a verdict
Field analytics usually records the last field reached in an incomplete session. A high count on “Phone number” makes that field worth investigating, but it does not prove the label alone caused abandonment.
Check:
- whether the field is required;
- whether its purpose is explained;
- whether the input type and mobile keyboard fit;
- whether validation rejects legitimate formats;
- whether the next field or step is the real obstacle;
- whether a technical error occurred after interaction;
- whether traffic quality changed.
Do not delete a necessary field from one chart. Change one thing, then compare a meaningful time window.
Validation errors need a denominator
“Email produced 400 errors” means little without attempts or sessions. Report:
- errors per submit attempt;
- affected sessions;
- error type;
- field;
- device or browser when useful;
- whether the person eventually completed.
A formatting error that most people fix in five seconds is different from an upload rule that blocks half the sessions permanently.
Track attribution without overclaiming
UTM source, medium, campaign, term, and content can explain which campaign produced the session. They do not prove which channel caused the conversion across the entire customer journey.
Useful attribution fields:
- first page URL for the form session;
- current referrer;
- UTM parameters;
- form ID and version;
- landing page;
- timestamp and date range.
Avoid copying sensitive submitted answers into analytics events. Form behavior and form content are different data classes.
Keep first-party form analytics privacy-conscious
Collect what you need to diagnose the form:
- form and field identifiers;
- event type;
- timestamps or aggregated date buckets;
- session identifier with a limited lifetime;
- attribution parameters;
- device category only when it changes decisions.
Avoid by default:
- raw field values;
- message text;
- passwords or secrets;
- file contents;
- full IP addresses retained indefinitely;
- cross-site identity stitching that the form does not require.
Core Forms stores form analytics in WordPress and documents event storage, privacy, funnel metrics, drop-off, attribution, and recommendations in its analytics documentation.
Separate form failures from action failures
A server can accept the submission while an email, CRM, spreadsheet, or webhook action fails. Decide what “complete” means for your workflow and expose action failures separately.
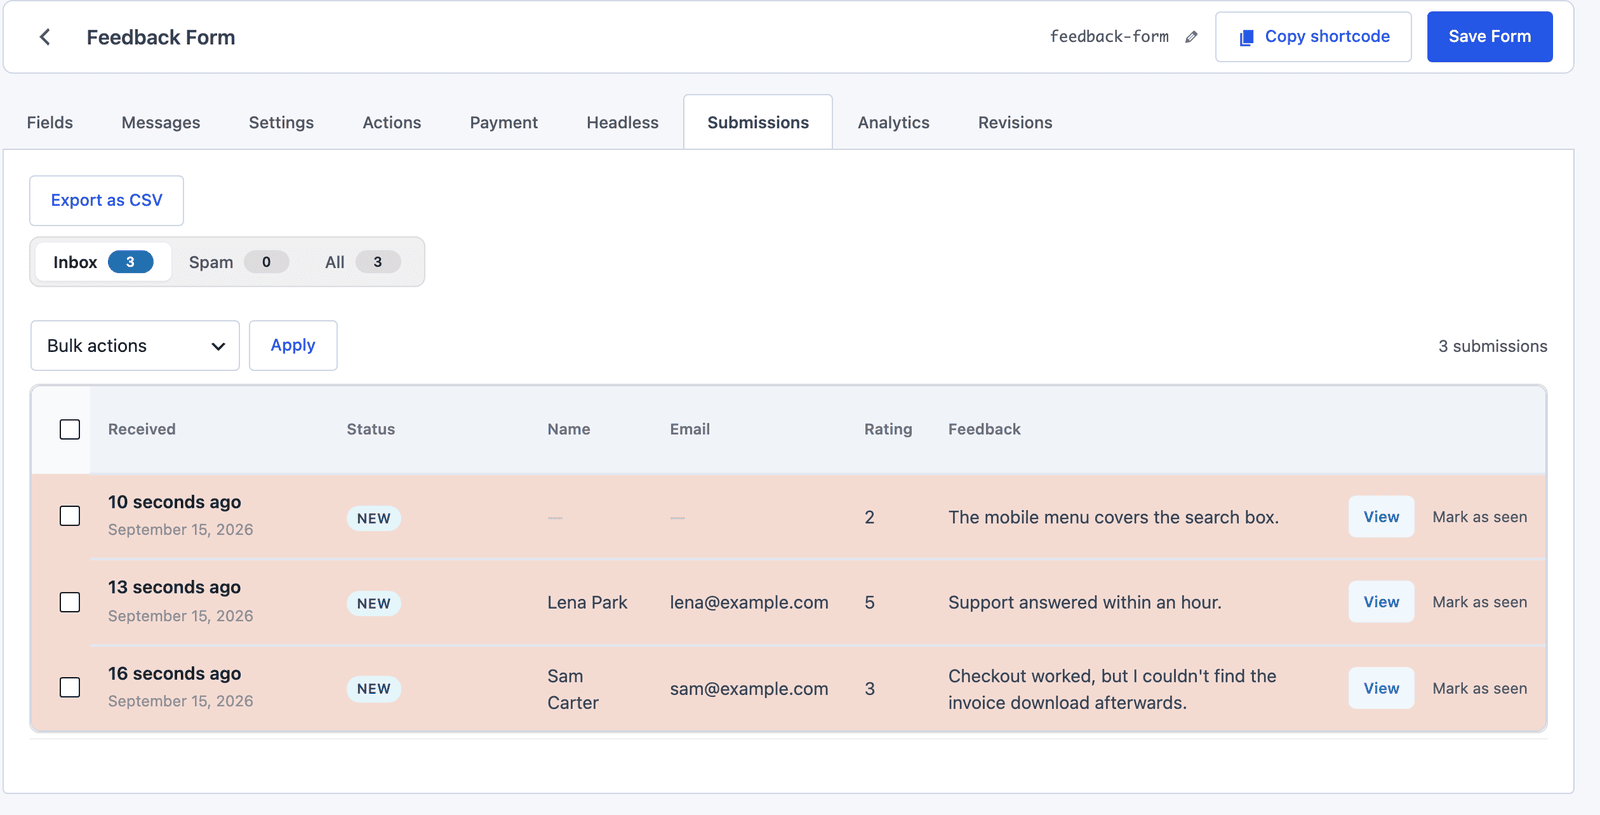 A saved submission and a successful downstream action are related, but they are not the same event.
Track at least:
- submission accepted;
- submission saved;
- each action attempted;
- each action succeeded or failed;
- retry count;
- final operational state.
This prevents an email outage from being misdiagnosed as bad form copy.
Use date ranges and form versions
Comparisons need stable definitions and enough data. Record when a meaningful form change went live.
Annotate:
- field additions or removals;
- required-state changes;
- copy changes;
- new traffic campaigns;
- layout or theme changes;
- integration changes;
- outages;
- spam-filter changes.
Compare like with like. Monday-to-Friday business traffic may behave differently from weekend traffic. A campaign landing page may not match organic visitors.
A practical analytics review order
Review metrics in this order:
- Traffic and form views: did the intended audience reach the form?
- Start rate: did the page and first screen earn interaction?
- Completion rate: did started sessions finish?
- Field drop-off: where did incomplete sessions stop?
- Validation: which rules created repeated recovery work?
- Actions: did the accepted data reach its destination?
- Outcome quality: were submissions useful, paid, qualified, or resolved?
Optimizing only the submission count can increase spam and weak leads. The business outcome still matters.
Build a small dashboard first
A useful per-form dashboard can show:
- views;
- starts;
- successful submissions;
- start rate;
- completion rate;
- top field drop-offs;
- validation-error count;
- source or campaign table;
- date comparison;
- action failures.
Do not start with dozens of charts. Start with the funnel and one diagnosis table. The Core Forms analytics feature follows that model and exposes reports through REST for teams that need their own dashboard.
Attribution by campaign needs the source captured on the form, and the UTM tracking guide covers the hidden fields that do it.
Once you have the numbers, the where users quit a form piece says what to change first.
FAQ
What is form completion rate?
Completion rate is successful submissions divided by started form sessions, multiplied by 100. State how a start and success are defined.
Is form conversion rate the same as completion rate?
Not always. Conversion may use page visitors or form views as the denominator. Completion rate normally uses people who started the form.
How do I measure form abandonment?
Count sessions that started but did not reach a successful server-confirmed submission, then inspect the last field or step reached.
Should analytics collect submitted field values?
Usually no. Behavior analytics can use form IDs, field identifiers, event types, and timestamps without copying personal answers into a second data store.
How long should I wait before changing a form?
Wait for enough comparable sessions to distinguish a pattern from noise, unless a clear technical or accessibility failure needs immediate correction.